
")
Axon™ pCLAMP™ 11

Die Axon™ pCLAMP™ Software Suite von Molecular Devices ist ein häufig verwendetes Programm zur Erfassung und Analyse elektrophysiologischer Daten und für die Steuerung und Aufzeichnung von Voltage-Clamp-, Current-Clamp- und Patch-Clamp-Experimenten. Axon pCLAMP 11 besteht aus Clampex 11 für die Datenerfassung, AxoScope 11 für die Hintergrundaufzeichnung, Clampfit 11 für die Datenanalyse und jetzt dem neuen optionalen Clampfit Advanced Analysis Module für eine noch ausgefeiltere und optimierte Analyse.
Wichtigste Funktionen:
- Programmieren Sie erweiterte Versuchsprotokolle mittels Protokoll-Editor.
- Analysieren Spikes und Aktionspotenziale.
- Beschleunigen Sie Ihren Experimentsablauf mit Makros für die automatische Ereigniserkennung und die Stapel-Datenanalyse im Clampfit Advanced Analysis Module.
Der Schwerpunkt der Axon pCLAMP 11 Software Suite liegt darauf, Anwendern mehr Flexibilität bei der Steuerung der Erfassung elektrophysiologischer Daten zu bieten. Die Vorgängerversion Clampex 10 verfügt bereits über leistungsstarke integrierte Funktionen, darunter einen flexiblen Protokoll-Editor, Membrantests, P/N-Leckabzug, Benutzerlisten und Sequenzierungstasten usw. In Clampex 11 haben wir diese Flexibilität noch weiter verbessert, indem wir einen neuen Protokoll-Editor mit einer erhöhten Anzahl von Epochen und einer längeren Sweep-Dauer im Erfassungsmodus „Episodische Stimulation” integriert haben. Der Gap-Free-Modus wurde durch die Möglichkeit, Epochen im episodischen Stil auszuführen und digitale und analoge Ausgänge zu programmieren, erheblich verbessert. Der neue Membrantest in Clampex 11 ermöglicht nun die gleichzeitige Anzeige mehrerer Kanäle. In jeder aufgezeichneten Zelle ist eine unabhängige Spannungsausgabe bei unterschiedlichen Stufenkonfigurationen möglich. Diese neuen Funktionen verleihen Clampex 11 eine große Benutzerfreundlichkeit, die es zur einer guten Software für die Steuerung von Experimenten macht.
Episodischer und kontinuierlicher Aufzeichnungsmodus
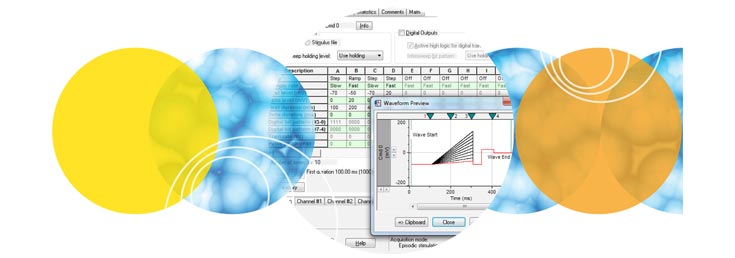
Clampex 11 ist ein hervorragendes Programm zur Stimulation von Zellpräparaten in einem sweep-orientierten „episodischen“ Modus. Stimulationswellenformen können aus einer Vielzahl von Quellen erstellt werden, z. B. aus dem Protokoll-Editor in Clampex 11, pCLAMP ABF-Datendateien und ASCII-Textdateien. Der neue Protokoll-Editor (Abb. 1) wurde verbessert, sodass nun 50 Epochen in der episodischen Stimulation möglich sind, und die maximale Sweep-Dauer wurde bei einer Abtastrate von 10 kHz auf 516 Sekunden verlängert. Die lückenlose Aufzeichnung (Abb. 2) bietet nun die Möglichkeit, Wellenformen auszuführen sowie analoge und digitale Ausgangssignale zu programmieren. Zu den Standardprotokollmustern gehören Stufen, Rampen, Kosinus-, Impulsfolgen (biphasisch), sinusförmige oder dreieckige Muster. Die Wellenformstimulation nutzt eine Vielzahl von Zeit- und Triggerhilfen, darunter Software-Protokollsteuerungen und -Sequenzierung, Hardware-, Software- und manuelle Triggeroptionen. Clampex 11 unterstützt acht digitale Ausgangsbits während Sweeps und acht simultane Wellenformen bei Verwendung mit dem Digidata® 1550B-Digitizer. Die erweiterte „Split-Clock”-Funktion ermöglicht es Benutzern, die Abtastrate während Sweeps auf Epochenbasis zu verschieben, z. B. bei sich langsam ändernden Konditionierungs- oder Erholungsphasen der Zellstimulation. Zur Vereinfachung der Bedienung werden alle Protokoll-Dauern in Zeit und Abtastraten in Frequenzen definiert.
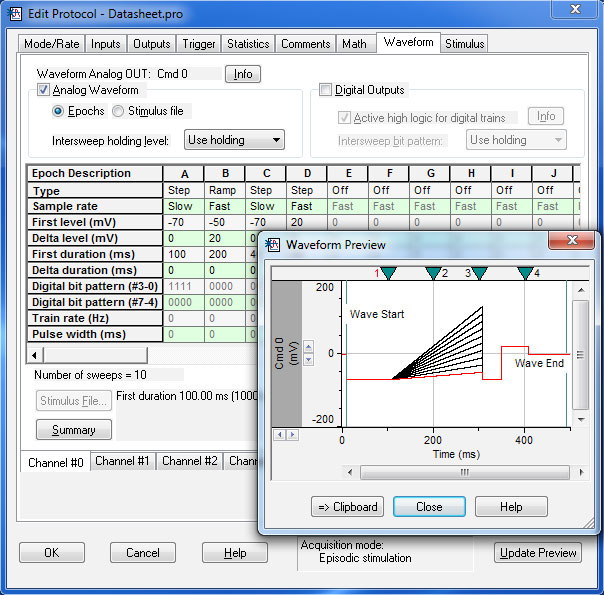
Für die kontinuierliche Aufzeichnung stehen vier verschiedene Modi zur Verfügung. Die lückenlose Aufzeichnung ist ein einfacher kontinuierlicher „Schreiber“-Aufzeichnungsmodus, der sich für die Überwachung von Einzelkanalereignissen, Minis und anderen spontanen Aktivitäten eignet. Neu in Clampex 11 ist, dass Benutzer nun Epochen im Stil eines Protokoll-Editors ausführen und digitale oder analoge Ausgänge in der lückenlosen Aufzeichnung programmieren können. Die Modi „Fixed- und Variable-Length Event Detection“ eignen sich für die Aufzeichnung spontaner Ereignisse mit regelmäßiger oder variabler Länge, die durch lange Inaktivitätsperioden voneinander getrennt sind. Der Hochgeschwindigkeits-Oszilloskop-Modus funktioniert wie ein Speicheroszilloskop, um getriggerte Sweeps mit fester Länge zu erfassen. Mit all diesen Aufzeichnungsmodi bietet Clampex 11 die erforderlichen Funktionen für eine Vielzahl einfacher und komplexer Versuchsprotokolle.
Filterung und Glättung von Daten
Clampex 11 kann verwendet werden, um Spannungsunterschiede zwischen angeschlossenen Instrumenten auszugleichen, Fehler im Flüssigkeitskontaktpotenzial aufgrund ionischer Lösungen zu korrigieren, passive Leckströme durch P/N-Leckabzug zu kompensieren oder hochfrequente Störsignale und langsame Basislinienverschiebungen durch Hochpass- und Tiefpassfilterung zu reduzieren. Clampex 11 kompensiert eine Vielzahl von Störquellen. Die Verstärkungs- und Filtereinstellungen für die Mikroelektrodenverstärker Axoclamp™ 900A und MultiClamp™ 700B werden per Software übertragen, sodass die Einstellungen des Mikroelektrodenverstärkers zusammen mit den Daten gespeichert werden. Mit Clampex 11 werden auch die neuesten BNC-übertragenen Verstärker unterstützt.
Zellüberwachung
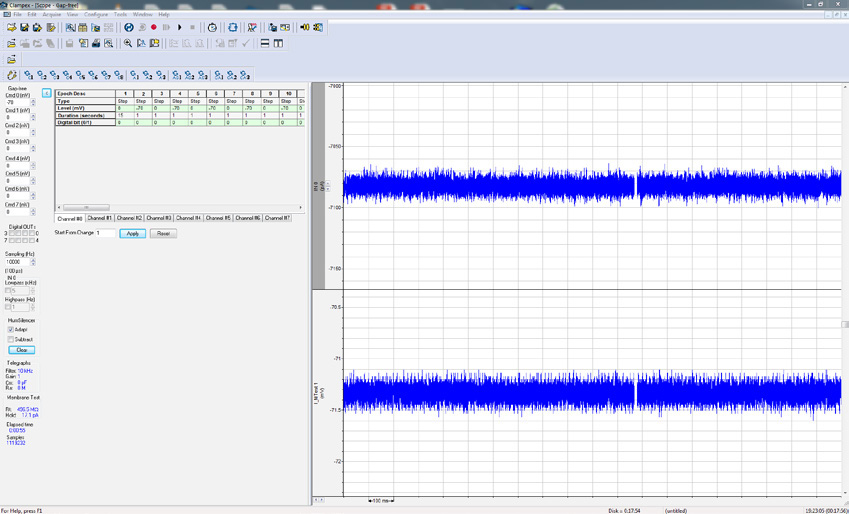
Das Membrantestfenster (Abb. 3) in Clampex 11 ermöglicht es Experimentatoren, den Pipettenwiderstand im Bad und die Bildung von hochohmigen Dichtungen zwischen einer Zelle und einer Pipette zu überwachen sowie die Zellkapazität (Cm), den Membranwiderstand (Rm) und den Zugangswiderstand (Ra) zu messen. In Clampex 11 wurde der Membrantest erheblich verbessert. Bei Verwendung mehrerer Kanäle werden alle Membrantestkanäle gleichzeitig in einem Fenster angezeigt, sodass Experimentatoren den Status jedes Kanals auf einen Blick sehen können. In jeder aufgezeichneten Zelle ist eine unabhängige Spannungsausgabe bei unterschiedlichen Stufenkonfigurationen möglich. Mit diesen Funktionen kann ein gesamtes Experiment in einer einzigen Datei aufgezeichnet werden, während gleichzeitig wichtige Zellparameter in Echtzeit überwacht werden.
Online-Analyse
Zur Analyse von Daten in Echtzeit verfügt der Clampex 11 über eine Online-Analysefunktion. Mit der Online-Analyse können mehrere Bereiche gleichzeitig anhand einer Vielzahl von peakbasierten Messungen wie Peakamplitude, Fläche, Mittelwert und Standardabweichung analysiert werden. Die Messbereiche können für LTP-Experimente in Echtzeit angepasst werden. Mehrere Messungen, wie Halbwertsbreite, Anstiegs- und Abfallzeiten sowie Anstiegs- und Abfallsteigungen, sind für Herzanalysen nützlich. Die Messungen werden in eigenen Fenstern angezeigt, und zur Vereinfachung der Interpretation werden verschiedene Kurvenfarben verwendet, um die einzelnen Suchbereiche zu kennzeichnen.
Sequenzierungstasten
Sequenzierungstasten steuern die Einrichtung und den Zeitablauf von Vorgängen, darunter das Laden von Protokollen, das Aufzeichnen von Daten, das Einstellen analoger und/oder digitaler Haltepegel, das Ausführen des Membrantests, das Einfügen von Kommentaren in das Laborbuch und die Datendatei sowie die Verknüpfung mit dem nächsten Vorgang. Durch die Verwendung von Sequenzierungstasten lassen sich komplexe Experimente leicht automatisieren, was eine leistungsstarke Möglichkeit zur Verknüpfung der Aktionen eines gesamten Experiments bietet.
Clampfit 11: intelligente Datenaufbereitung und -analyse
Der Clampfit 11 bietet spezielle Funktionen zur schnellen Aufbereitung und Analyse von Daten. Mit Hochpass-, Tiefpass- und Bandpassfiltern mit Bessel-, Butterworth-, Tschebyscheff-, Gauß- oder RC-Ansprechverhalten können Störsignale aus den Signalen entfernt werden. Mit speziellen Kerbfiltern und Filtern für elektrische Störungen lassen sich bestimmte Störfrequenzen und Oberschwingungen aus den aufgezeichneten Signalen entfernen. Zur Anpassung der Basislinien von Aufzeichnungen stehen verschiedene Methoden zur Verfügung: Konstante Werte oder Durchschnittswerte können von allen Punkten der Aufzeichnung subtrahiert werden, linear driftende Basislinien können durch Anwendung einer Steigungskorrektur angepasst werden, oder bei instabilen Basislinien kann eine manuelle Korrektur mit einer Polylinie vorgenommen werden. Weitere Datenanalysefunktionen sind Mittelwertbildung, Normalisierung, Kontrollsubtraktion und Spike-Ausrichtung.
Datenanalyse
Clampfit 11 enthält eine umfassende Palette von Werkzeugen zur Analyse und grafischen Darstellung elektrophysiologischer Daten. Benutzer können aus 37 vordefinierten Funktionen auswählen oder eigene Funktionen definieren. Anpassungs-Seeds können individuell angepasst werden, und Anpassungen können extrapoliert werden, um Kurven, Komponenten, Residuen, Taus usw. anzuzeigen. Zu den speziellen Analysewerkzeugen gehören die Fast-Fourier-Transformation, die Varianz-Mittelwert-Analyse, die Perievent-Analyse, die Burst-Analyse und andere statistische Analysen. Zur Anzeige der Ergebnisse und Daten stehen im Grafikfenster verschiedene Diagrammtypen zur Verfügung.
Die Grafiken sind dynamisch mit dem Ergebnisfenster verknüpft, sodass alle im Ergebnisfenster vorgenommenen Änderungen auch die entsprechenden Daten im Grafikfenster aktualisieren. Zahlreiche Spitzenwerte können direkt gemessen werden. Es können 24 separate Bereiche von Interesse neben einen Basisbereich ausgewählt werdeen, wodurch die Analyse komplexer Daten ermöglicht wird. Online-Statistiken können während der Offline-Überprüfung neu erstellt werden, sodass keine separaten Statistikdateien während der Erfassung gespeichert werden müssen. Ein Leistungsspektrum (FFT) für die Rauschanalyse kann auf einzelne, gemittelte oder segmentierte Spektren angewendet werden und erzeugt ein logarithmisch skaliertes Diagramm der Ergebnisse. Standardmäßige Auto- und Kreuzkorrelationsanalysen bieten die Möglichkeit, Daten für Muster innerhalb oder zwischen Populationen zu vergleichen. Für Studien zur synaptischen Modulation bietet die V-M-Analyse in Clampfit 11 eine robuste Methode zur Identifizierung prä-/postsynaptischer Stellen.
Ereigniserkennungsanalyse
Clampfit 11 verfügt über eine äußerst flexible Ereigniserkennung, die spontane und evozierte Aktionspotenziale sowie postsynaptische Daten analysiert. Ereignisse werden entweder durch Threshold oder Template-Vergleich erkannt. Letztere sind für die Analyse spontaner Ereignisse wie mEPSPs und mIPSPs ausgelegt, welche in Amplitude aber nicht in Form variiren. Kategorien von Ereignissen können gleichzeitig erkannt und für eine sekundäre Analyse sortiert werden. Die integrierte Umgebung von Clampfit 11 verknüpft die erkannten Ereignisse in den Daten mit den Tabellenkalkulations- und Grafikfenstern, um eine schnelle Auswertung der Informationen im Kontext des gesamten Datensatzes zu ermöglichen.
Einkanalanalyse
Die Einkanalanalyse von Clampfit 11 ermöglicht die vollständige Verarbeitung von bis zu 1 Million Ereignissen in kontinuierlichen und episodischen Daten. Offene, geschlossene und Subleitfähigkeitszustände von Ionenkanälen in natürlichen oder künstlichen Membranen werden erkannt und gemessen. Es werden bis zu acht Stufen offener Zustände unterstützt.
Eine Anpassung für die Basislinienverschiebung kann automatisch angewendet und eine idealisierte Aufzeichnung der Kanalaktivität erstellt werden. Es können Amplituden- und Verweildauer-Histogrammdiagramme, einschließlich Log- und kumulativer Diagramme, erstellt werden. Clampfit 11 verfügt auch über spezielle Analysen wie P(open), Burst-Analyse, Latenzanalyse, evozierte Antwortanalyse und nichtstationäre Fluktuationsanalyse zur Schätzung der Kanalleitfähigkeit.
Tabellenkalkulationsanalyse
Die primären Analyseergebnisse werden in eine Tabellenkalkulation übertragen, in der sekundäre Analysen durchgeführt werden können. Diese Ergebnisse können innerhalb von Clampfit 11 analysiert oder zur weiteren Analyse in Microsoft Excel exportiert werden. Die in Clampfit 11 verfügbaren Sekundäranalysen sind Varianzanalyse, F-Test, Chi-Quadrat-Test, Kolmogorov-Smirnov-Test, Rangkorrelationen und Student-t-Test. Die grafische Darstellung von Sekundärdaten ist ganz einfach: Wählen Sie eine Datenspalte aus und klicken Sie auf die Schaltfläche „Create Graph“ (Grafik erstellen). Zu den verfügbaren Grafikoptionen gehören Linien-, Streu- und verschiedene Histogrammdiagramme (z. B. normalisiert, Frequenz, logarithmisch [Quadratwurzel] und kumulativ).
Clampfit Advanced Analysis Modul
Das Clampfit Advanced Analysis Modul ist eine Reihe von Tools, die die Funktionen von Clampfit erweitern, um leistungsstarke Analysen mit Benutzerfreundlichkeit zu kombinieren. Die Batch-Analyse-Makros erlaubenm Automatisierungsprinzipien zur Analyse ähnlicher Datensätze anwenden. Darüber hinaus verfügt es über spezielle Algorithmen, um die Funktionen der Ereigniserkennung zu erweitern.
Automatische Ereigniserkennung
Das Clampfit Advanced Analysis-Modul bietet eine Erweiterung der bereits hochentwickelten automatischen Ereigniserkennungs-Engine, die in Clampfit integriert ist. Die automatische Ereigniserkennung identifiziert Ereignisse anhand benutzerdefinierter Parameter. Während der Erkennung können programmgesteuerte Messungen durch grafische Neupositionierung der Spitzen und Endpunkte der Ereignisse bearbeitet werden. Wenn sie in einem optional festgelegten Suchbereich enthalten sind, werden Stimulusartefakte automatisch erkannt und zur Bestimmung der Latenzzeiten verwendet. Mehrere Spike-Reaktionen und gepaarte Impulsdaten werden ohne zusätzliche Einrichtungsanforderungen verarbeitet.
Spike-Analyse
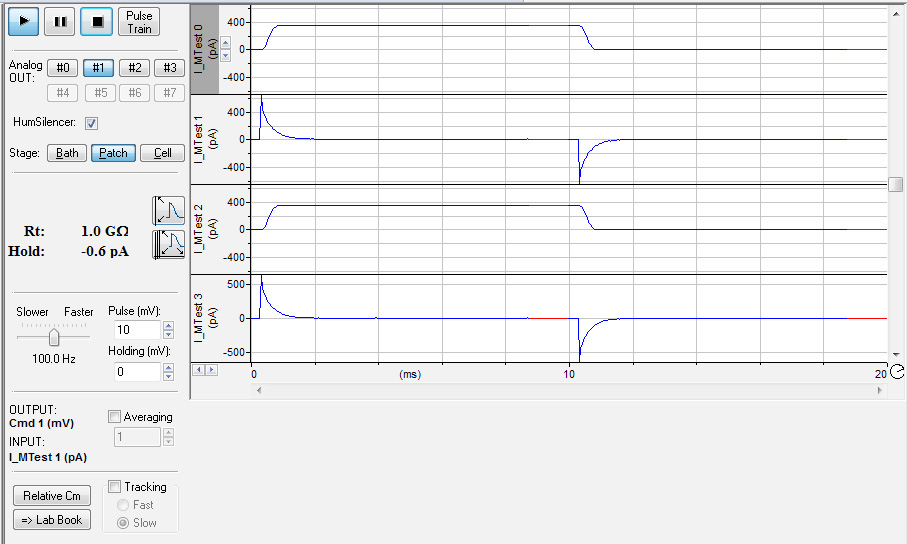
Aufzeichnungen von Spikes (Abb. 4) und Paarimpulsexperimente mit dem erweiterten Analysemodul in Clampfit 11 leicht zu analysieren. Dazu ist eine Schnittstelle vorhanden, über die Richtung des Spike auszuwählen und den zu analysierenden Bereich festzulegen, zur Analyse von Amplitude, Fläche unter der Kurve, Halbwertsbreite, Anstiegszeit, Abfallzeit, Anstiegssteigung, Abfallsteigung, Spikeform und gepaarten Impulse. Diese Werte werden in das Ergebnisblatt zur weitere Analyse.

Aktionspotentialanalyse
Die Aktionspotentialanalyse verwendet die automatische Ereigniserkennung, um alle Aktionspotentiale zu erkennen. Das Tool analysiert automatisch die Datendatei und ermittelt die Amplitude, APD90, Anstiegszeit, Abfallzeit, Anstiegssteigung, Abfallsteigung, Spike-Frequenz, Spike-Spike-Zeit, Amplitudenänderung pro Spike, Nachpotentialamplitude, Nachpotentialdauer und Schwellenpotential. Das Aktionspotentialanalyse-Tool kann auch zur Analyse von Aktionspotential-Impulsfolgen verwendet werden.
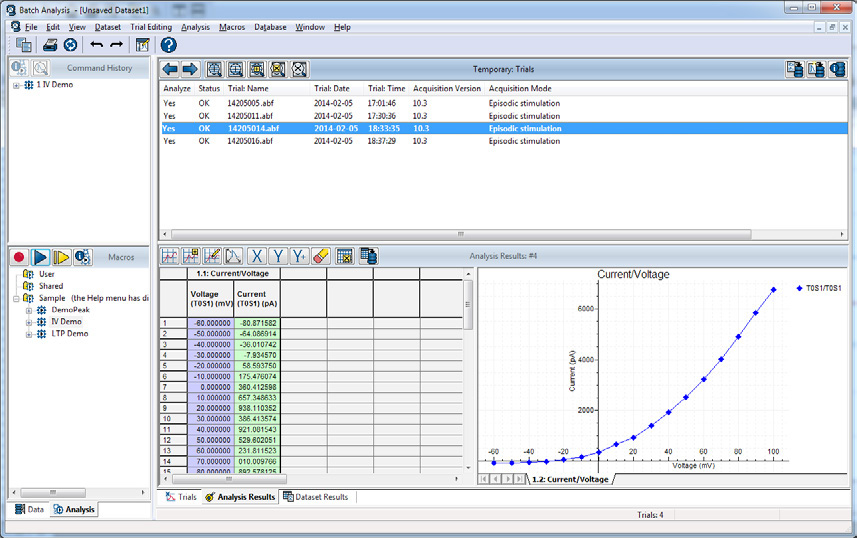
Makros zur Stapelverarbeitung von Daten
Das Clampfit Advanced Analysis Module enthält ein Makro zur Stapelverarbeitung von Daten (Abb. 5), mit dem Experimentatoren Makros zur Analyse erfasster Daten anwenden können. Die Stapelverarbeitung spart Zeit, indem sie große Datenmengen analysiert, die nach dem gleichen Protokoll erstellt wurden. Richten Sie Ihre Analyse einmalig ein und wenden Sie sie dann auf neu erfasste Daten an. Um die Batch-Analyse zu verwenden, aktivieren Sie einfach die Makroerfassungsfunktion, analysieren Sie Ihre Daten und speichern Sie das Makro. Wenn Sie weitere Daten analysieren möchten, die mit demselben Protokoll erfasst wurden, wenden Sie einfach das gespeicherte Makro an, und Ihre Daten werden automatisch analysiert.
Systemanforderungen
Betriebssystem Windows 7 Pro (32- und 64-Bit), Windows 10 Ent. (32- und 64-Bit), oder höher
CPU PC mit 2,0 GHz (oder schnellerem) Prozessor
RAM 4 GB oder mehr
Bildschirm Auflösung von 1440 × 900 oder höher
Anschlüsse 3 USB (für Sicherheitsschlüssel, Digitizer)
- Axon Digidata 1550B 8-Kanal-Digitizer
- Axon Digidata 1440A 16-Kanal-Digitizer
- Axon MiniDigi 1 Zweikanal-Digitizer
- Axon Axoclamp 900A Verstärker für scharfe Elektroden
- Axon Axopatch 200B Mikroelektrodenverstärker
- Axon MultiClamp 700B Mikroelektrodenverstärker
- Die meisten BNC-verdrahteten Verstärker werden ebenfalls unterstützt (alle früheren Versionen der Modellreihe von Axon Instruments).